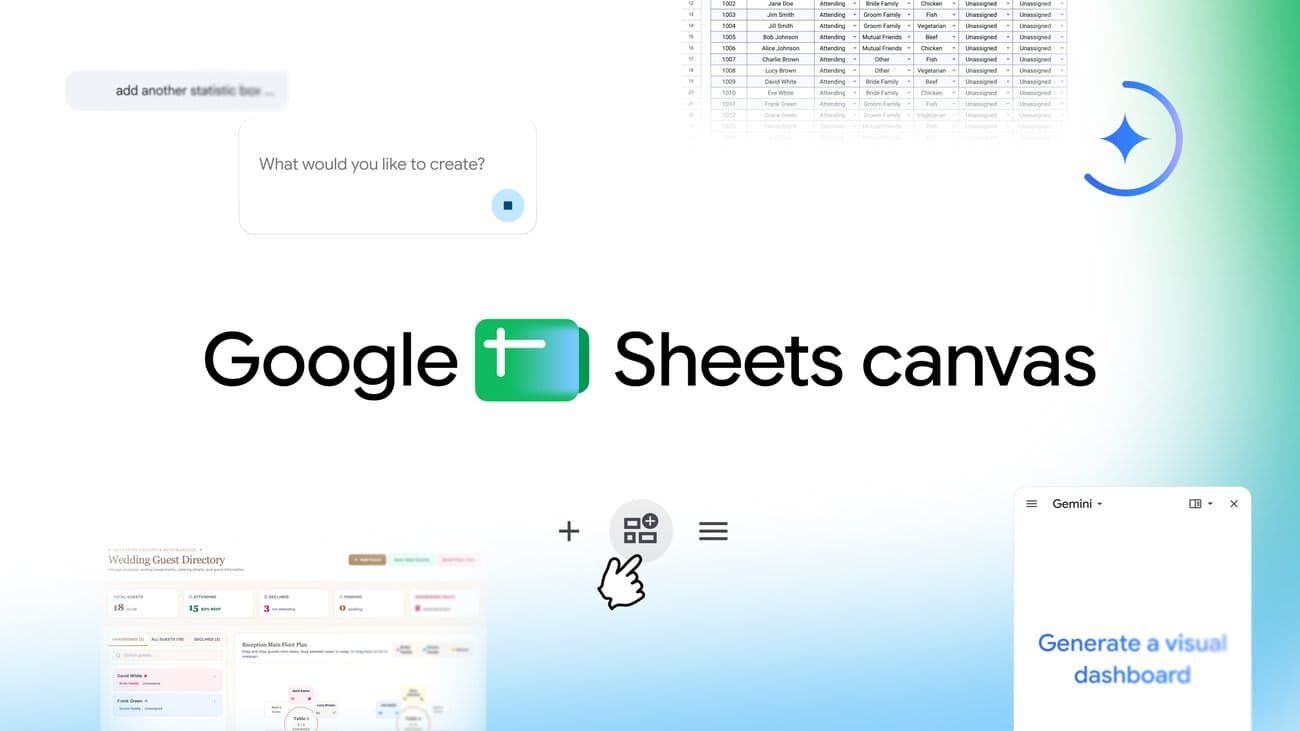
For decades, the humble spreadsheet has served as the backbone of global commerce. From tracking inventory levels in a small warehouse to managing multi-million-dollar project portfolios, the grid of rows and columns has been the lingua franca of business operations. However, the limitation has always been one of accessibility: spreadsheets are structurally rigid, often serving as static repositories rather than dynamic tools for insight. That narrative is shifting rapidly as the interface between raw data and human cognition is being reimagined through generative AI.
The evolution we are witnessing—moving from manual data entry to "canvas-based" interaction—is not merely a stylistic update; it is a fundamental reconfiguration of how organizations interact with their digital assets. We are entering an era where data is no longer something you stare at, but something you converse with.
The Shift from Static Grids to Dynamic Context
Traditionally, turning spreadsheet data into a functional interface required a degree of technical fluency that often siloed the task to data analysts or IT departments. If a marketing lead wanted a custom seating chart for an event or an interactive project tracker that behaved like an application, they would either spend hours formatting cells or rely on specialized, often expensive, third-party software.
The introduction of Sheets Canvas and similar generative interfaces marks the end of this friction. By leveraging large language models to interpret the intent behind a dataset, these tools allow users to transform a wall of numbers into a curated, interactive application in seconds. Instead of navigating through sub-menus or writing complex formulas, a user can simply prompt the system to reformat a raw sales lead log into a dynamic pipeline manager.
This transition from "managing cells" to "defining outcomes" yields several immediate benefits for the enterprise:
- Democratic Data Utility: Non-technical employees can now architect their own workflows, reducing the backlog on technical teams who previously had to build these custom tools manually.
- Contextual Agility: Business environments move fast. Being able to change the structure of a dashboard on the fly allows teams to pivot their focus without needing a complete system overhaul.
- Higher Data Engagement: Visual, interactive dashboards are significantly more effective for decision-making than stagnant rows. When users can click, drag, and reorganize their data-driven environment, they are more likely to uncover patterns that would otherwise be buried in a pivot table.
Implications for Digital Transformation and ROI
From a C-suite perspective, this shift represents a significant move in the ongoing quest for Digital Transformation. Many companies are still operating on legacy infrastructure that fails to integrate with modern collaborative tools. When data is trapped in disconnected spreadsheets, it becomes "dark data"—valuable information that isn't being leveraged for strategic advantage.
By adopting AI-driven canvas technologies, organizations can bridge the gap between their foundational data and their operational execution. The ROI here is twofold. First, there is an immediate gain in productivity; the time saved by automating the creation of reports and custom trackers adds up to hundreds of hours annually per team. Second, the impact on decision-making quality is profound. When an organization can visualize its CRM data or project milestones in an intuitive, AI-generated dashboard, the latency between an insight emerging and a decision being executed shrinks significantly.
Furthermore, these tools are becoming foundational components in the ecosystem of AI Agents. As companies move toward agentic workflows—where software performs tasks autonomously—the ability to render that output into a manageable "canvas" becomes critical. An AI agent managing a procurement list can now feed that data directly into a dynamic tracker that a human manager can audit, approve, or adjust with a simple natural language prompt. This creates a powerful loop of human-AI collaboration, where the agent handles the heavy lifting, and the human remains in control of the strategic design.
Adopting the Canvas Mindset
For business leaders looking to integrate these capabilities, the challenge isn't necessarily technical—it’s cultural. It requires moving away from the "data as a filing cabinet" mentality toward a "data as an interface" mindset. Adoption should follow a strategic roadmap:
- Inventory Your Bottlenecks: Identify the specific departments—such as HR, Sales, or Operations—where employees are currently struggling with manual data management or "spreadsheet fatigue."
- Empowerment Over Control: Provide training that encourages employees to experiment with generative data tools. The goal is to move them away from rigid templates and toward creating bespoke tools that solve their specific functional requirements.
- Prioritize Integration: Ensure that your data architecture allows for seamless flow between your primary business tools (such as your CRM or ERP) and these new interactive canvases. A tool is only as good as the data it consumes.
Looking ahead, we can expect the boundary between specialized business software and general-purpose data tools to continue blurring. The future belongs to organizations that can pivot their internal processes as quickly as their business strategy changes. By treating data as a malleable substance that can be shaped by AI, companies can foster an environment where agility isn't just a buzzword, but a core competency of their operational stack.
As these AI-driven workflows become standard, the ability to build sophisticated, custom-fit internal tools will distinguish highly efficient companies from those still laboring under the weight of static grids. At AOODAX, we specialize in helping businesses navigate this transition, whether by developing bespoke AI agents that automate complex tasks or by integrating intelligent interfaces that bring your team’s data to life.